Towed-Diver Surveys
Written By Dan Suthers based on conversations with Brian Zgliczynski, Joe Laughlin, Molly Timmers, and Casey Wilkinson.
How do you study a reef?
If you wanted to study a reef ecosystem, how would you do it?
Suppose you wanted to know whether and how the abundance and distribution of life in the reef was changing, in order to better manage the reef. How would you do that? Would you just send a diver to jump in the water and look around?
One problem that you'd need to solve is that there are so many kinds of things to look at. You need specialists from many disciplines working together on the same reef.
Another problem to solve is how much of the reef to look at. You need to look closely and carefully to identify and characterize the health of life that can't be assessed at a glance, but you also need to cover large areas to be sure you have data representative of the entire reef and not just the particular spot you happened to pick.
A third problem is that it isn't enough to just look once. Our reefs may be changing, so it is important to return to the same area and compare your observations to those made in previous years.
Finally, you also need to measure the characteristics of the physical environment in the area, so you know what might be affecting life on the reef.
We've already summarized the study of the physical environment in an article on reef-specific oceanography. Two other major activities are undertaken on this expedition to gather data on reef life. In this article, we'll focus on towed diver surveys: a data gathering method especially well suited to meeting the need to cover large areas of the reef in a short period of time. In a future article we'll consider Rapid Ecological Assessments (REAs), a method used to characterize a sampling of reef locations in detail by multiple specialists.
Towed-Diver Surveys
Towed-diver survey is a reef assessment method developed in the early 1990's to assess lobster habitat by scientists at the Pacific Islands Fisheries Science Center and refined by others. Similar techniques are used in the Carribean, and with snorkelers in Australia. The protocol used in the NWHI Reef Assessment and Monitoring Program involves two divers towed behind a small boat at constant speed (1.5 knots). One diver specializes in fish, and the other in the benthic (bottom) environment. There are four divers on the team so that they can take turns on this sometimes monotonous work, and so there is someone to drive the boat. For example, on this expedition, Brian Zgliczynski and Joe Laughlin handle fish, and Casey Wilkinson and Molly Timmers handle habitat.
Towboard Instruments
 The image at right of Casey on the Hi`ialakai shows the bottom of the towboard, and the image to the left shows the top of the towboard in use. As you can see, a towboard is a board with a bridle for attaching the towline and handles for the diver to hold on to. There is also a "tag line": a rope trailing behind that the diver can grab if s/he slips off the board. Each towboard has a temperature and depth sensor (the tubular device facing forward) that records these parameters every 5 seconds. There is a small tube on which the divers affix a stopwatch and a clock time watch, as well as their dive computer (the device that tells them how deep they are and how fast they can ascend). The fish towboarder's board has a button for a telegraph system used to signal the boat operators. Signals include start, stop, right, left, faster, slower, OK, and emergency. This system is especially important for deeper tows.
 In the center of each towboard, a camera is mounted. As seen on the towboard used by Brian in the image at left, the fish towboard has a video camera pointed forward to record relative abundance of fish that are larger than 50cm in length along a 10 meter swath. This video record is also analyzed to identify large scale habitat. The benthic towboard has a still camera and strobe-lights pointed downwards (see image in right sidebar) to record the composition of the benthic habitat every 15 seconds. The divers also have charts on which they record observations, seen on the right of the towboard. The fish diver records all fish over 50cm, identified to the species level. The benthic diver records type of benthic habitat every 5 minutes and tallies macroinvertebrates such as crown of thorns, lobster, octopus, sea cucumbers, etc. These records are important because the cameras may not capture fish and invertebrates out of the range of the camera, and the written record enables a quick initial review of what is being seen before time consuming analysis of the video or image record is conducted. Also the two sources of data can be checked against each other. NWHI RAMP scientists are finding that the diver's record of visual observations does get more of the larger fish, such as jacks and sharks, which usually approach from the side or behind the diver. (The divers jokingly refer to themselves as "shark bait.")
Survey Protocol
Tows are conducted in multiple habitats around the atoll, including the forereef (just outside the atoll), backreef (just inside the atoll) and lagoon (interior of atoll). Most surveys focus on depths between 10 and 15 meters, except where the water is shallower. For a shallow tow, 20 meters of rope is used, and for a deep tow, 60 meters. The towboarders try to stay 1-2 meters off the bottom, which can be a challenge when crossing gullies and spurs. Each tow covers about 2 kilometers [1].
During the first years of the NWHI RAMP, the scientific team could choose the survey locations, but now that the expeditions are doing monitoring rather than initial surveys, they must follow previous tracks as closely as possible using GPS (global positioning system) technology. Some of the tows overlap with the REA team sites (which other scientists examine in detail), in order to extend the range of the REAs and give a larger scale characterization of the same environments. The idea is to gather data in as many ways as possible to make sure we are not missing anything in this complex environment, and to involve specialists from multiple disciplines so as to better understand the ecosystem.
 Each tow lasts 50 minutes, divided into 5 minute intervals. On dives deeper than 15 feet, 10 minutes is added at the end for a "safety stop" at 15 feet. At the beginning of the dive, when the fish towboarder telegraphs "start," those on the boat record the latitude and longitude using a GPS device (small device above steering wheel in picture). The position is recorded again at the end of the tow when "stop" is signaled. Then the the location of data taken (e.g., the pictures taken by the benthic towboarder) can be calculated by offsetting the GPS location by 20 or 60 meters (depending on the length of the rope), and interpolating based on time. For example, a data point taken 10 minutes into the 50 minute tow would be 1/5 of the way between the two rope-adjusted locations. All of this work is done in a GIS (geographic information system) computer program.
Data Analysis
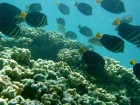
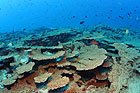
The benthic photographs are analyzed to categorize the environment in a manner similar to the TOAD data: sand, rubble, coral, rock etc. Percentages of the 3-4 major species of coral common in the area are determined, and any other coral species that can be identified are noted, as well as whether any of the coral is bleached. Three types of algae and categories of fish and invertebrates are also identified.
The fish data (data sheets and video) are used to estimate fish biomass ("how much" fish are in the area by weight). The number of fish within each of nine size ranges is tallied up. Then, using the average weight per fish within each size range and an estimate of the area surveyed, it is easy to compute an estimate of the fish biomass in the reef surveyed. Fish biomass is an important measure of the productivity of a reef ecosystem.
Do It Again!
Reef environments are changing. For example, there are changes in fishing policies and pollutants, natural weather cycles such as El Nino, and global warming. In order to be able to effectively manage our reef ecosystems, is necessary to monitor reefs on a regular basis and detect trends against the baseline data that has been gathered by this expedition and its predecessors.
Towed diver surveys provide an effective method for fast coarse-grained monitoring of reef health. In a future article we look at another method that provides a much more detailed record of the life that occurs together in a given reef habitat.
[1] A knot is one nautical mile per hour. A nautical mile is 1.852 kilometers. So a more precise prediction is obtained as follows: 1.5 knots * 1.852 = 2.778 kilometers per hour. The tow lasts 5/6 of an hour, so 2.778 * 5/6 = 2.3 kilometers covered.