Reef Oceanography
Written By Dan Suthers based on explanations by Scott Ferguson, June Firing, Kyle Hogrefe, and Danny Merritt.
Physical Oceanography
Physical Oceanography studies the movement of ocean water (ranging from small scale oscillations to basin-wide flows) and the physical and chemical characteristics of that water (e.g., temperature and salinity). Most research on currents and water characteristics has focused on large scale patterns, such as gyres that flow around ocean basins [1]. Water of different densities does not mix easily. Density depends on temperature and salinity. Therefore, if you measure the temperature and salinity of water at different depths you can track the same body of water as it moves around an ocean basin (e.g., the North Pacific) and even around the globe.
In this research, measurements are often taken on a large scale. For example, during a transect a ship might make measurements of water temperature and salinity at different depths, but do so only at every degree of longitude or latitude: about every 60 miles. One square kilometer is a standard resolution for satellites that calculate sea surface temperature. This research helps us understand major influences on reef life, such as transport of warm or cold water, nutrients, and possibly organisms from one region to another. However, the data gathered for oceanography at this scale is not detailed enough to understand how water characteristics influence life at a local level.
Reef-Specific Oceanography
Reef-specific oceanography studies the currents and water characteristics on a local scale. The topography of a reef--where it's shallow and deep; how it's situated relative to ocean currents and prevailing winds--can influence water temperature and the distribution of nutrients beyond what can be predicted by looking only at large scale currents in the region of the reef. Marine biologists such as those on this expedition study the distribution of marine life on a local scale, comparing for example life at different depths and within and outside an atoll, as well comparing reefs at different locations in the island chain. In order to understand the distribution of life they are seeing, they need reef-specific oceanographic data.
Data for reef-specific oceanography is being gathered by taking direct measurements while we are up here, by leaving sensors in place that send their data back by satellite or are retrieved later, and by satellite imagery. The first two forms of data, measured directly on site, help scientists to "ground truth" satellite data: observations in the field are compared to what the satellite sees so that we know how to interpret the images.
Reef Oceanography data is being gathered on this expedition by two teams: Night Operations (Scott Ferguson, assisted by Drew Rapp), who operate off the Hi`ialakai; and the Mooring Team (Elizabeth Keenan, Danny Merritt, Stephani Holzwarth, and team leader Kyle Hogrefe), who operate off of the jet boat HI-2. The instruments they use and what they measure are described below. As we consider this diverse collection of instruments we should keep in mind that they are all contributing to the same objective: to have an empirically based model of how ocean water characteristics are distributed across space and time. The most important water characteristic studied from the point of view of reef health is temperature. See our article on coral bleaching for a discussion of how temperature can affect the symbiotic relationship between coral and algae. Reef life is also strongly affected by the availability of nutrients. Both temperature and nutrients, in turn, are affected by the movement of water, so some of the measurements made are intended to give a profile of the bodies of water surrounding reefs.
Yearly Water Column Measurements
Some measurements are only taken about once a year, when researchers can come up to the locations where the measurements are made.
Ship-based CTDs. The Night Operations team conduct Conductivity, Temperature and Depth or "CTD" measurements at several locations around the reef. (They also make observations with a Towed Optical Assessment Device, but this is for unrelated purposes: see the September 18th journal for a brief description.) The CTD deployed by Night Operations is a large device that can reach 500 meters in depth, taking up to five water samples at different depths, and making other measurements on a continuous basis on the the way down and up.  Temperature and pressure are measured directly. Salinity is measured indirectly by measuring the conductivity of water to electricity. Chlorophyll is measured indirectly by a fluorometer that emits purple light ("black light") and measures fluorescence in response to that light. These measurements are made continuously, providing a profile of temperature, salinity, and chlorophyll as a function of depth. The photograph shows the dta from a test run of the CTD, including temperature (blue), salinity (red) and density (green).
Analysis of the water samples will tell scientists how much chlorophyll is actually in the water. This information can then be compared to the measurements of the flurometer to see how well it predicts levels of chlorophyll. The presence of chlorophyll is a good sign of producivity: the food chain is built on phytoplankton (microscopic plants) that produce food energy from light energy. They are eaten by microscopic zooplankton (floating animals), which in turn are eaten by larger animals, and so on.
Shipboard CTD measurements are typically taken at three locations around a given island or atoll: the windward and leeward sides, and at a standard oceanographic "station" assigned to each island or atoll that is being surveyed over a long period of time. There is one such station per each major island or atoll in the NWHI: Nihoa, Necker, French Frigate Shoals, Gardner, Maro Reef, Laysan, Lisanski, Pearl and Hermes, Midway, and Kure.
Shallow water CTDs. In order to understand the local reef ecosystem, we need measurements at more locations than just three, and we need to sample in shallower water than the ship can operate in. For these reasons, the oceanographers aboard make other measurements from the HI-2 jetboat. These measurements are taken every mile or two around the island/atoll between the 80 and 120 foot isobath and inside the atolls in a few places as well, providing greater resolution.
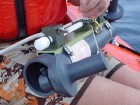
A handheld CTD device is pictured. Like its big brother, it includes a temperature sensor, a depth sensor, and a conductivity sensor (for salinity). The handheld device also has transmissometer that measures the level of particulate matter in the water (a proxy for turbidity). It does so by shining a light at a sensor and seeing how much of that light gets through the water. These measurements are also made continuously as the device descends and ascends. Unlike the larger version, the small boat CTD does not take water samples and does not have a fluormeter. Separate devices are used for these purposes.
Water samples are taken by a handheld device consisting of a tube with spring loaded caps at both ends. The caps are set in the open position so water can flow through the tube as it descends. A weight is then slid down the supporting rope to hit a trigger and close the caps. The sampler is then taken to the surface, where the water is used to first rinse out a sample bottle (to avoid contamination from other water), and then the sample bottle is filled. The bottle is opaque to prevent further modification of the chlorophyll content by light. (Water from the large CTD is also stored in these same bottles.) Water samples are typically taken at three depths, 5, 30 and 60 feet, measured out by marks on the rope holding the sampling device.
A radiometer on the small boat plays the role of the fluorometer, and also gives important information about available solar radiation. Two radiometers are coupled together to take readings above and below water. A instrument on the boat reads the amount of light arriving at the ocean surface. Another instrument is put in the water to read the light reflected back from the water. This is compared to the former surface measurement for reference. These measurements are made at light frequencies relevant to photosynthesis. By reading reflected light at certain wavelenghths, scientists can tell how much chlorophyll is in the water.
Time Series Measurements
The measurements just described provide a lot of detail about the water at a given location and different depths, but only at one or a few points in time: when the scientists can come up here. To fully understand an ecosystem, we need to monitor it over many years. The instruments described in this section record a series of measurements of water characteristics over time. They include CREWS buoys, SST buoys, and SST "pipe bombs."
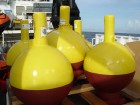
 CREWS Buoys. These are large buoys (pictured) that are anchored at a specific location and can send data back daily to scientists via satellite. CREWS stands for Coral Reef Early Warning System, reflecting a major function of these buoys: to warn scientists as soon as possible of an unusual change taking place in the environment of a coral reef ecosystem. These buoys have sensors both in and above the water that measure water and air temperature, water salinity (via conductivity), wind speed, and barometric pressure. A few of them also have radiometers, but these can only be located where staff can get to them every few weeks to clean the sensors. There is one at French Frigate Shoals, serviced by USGS staff on Tern Island.
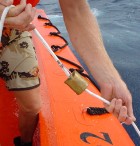
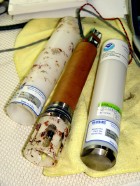
SST Buoys and Pipes. CREWS buoys are large and expensive, so other instruments are also used that measure fewer parameters but can be deployed in more locations. Sea Surface Temperature (SST) buoys are round floating buoys that are anchored in a specific location. They measure water temperature and send this data back at regular intervals via satellite. The "pipe bombs of science" are strapped to the reef at different depths and locations around an atoll. These are set to measure temperature every half an hour, and record it on a data chip. Scientists must come up to the NWHI and retrieve these devices in order to obtain the data.
Tracking Water Movement
Currents, tides and waves also affect reef life. The mooring team installs two further kinds of instruments to track these parameters. Now we can appreciate why they are always so busy!
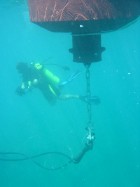
Wave and Tide Recorders (WTDs), record water pressure with high sensitivity, providing information about waves and tides. (When a wave passes over, or when the tide comes in, there is more water over the instrument and hence more pressure on it.) This instrument measures the tide 48 times a day, and records wave height 8 times a day in the process. Each measurement involves recording the pressure for 18 minutes, and then estimating wave and tide values based on changes in the pressure. They are deployed at 50 to 100 feet.
The Ocean Data Platform (ODP) contains temperature and salinity sensors, as well as an Acoustic Doppler Profiler (ADP). The ADP can measure current speed and direction in multiple directions and at different depths. These are placed at 60-100 feet, "hopefully deeper than the wave energy you are trying to study," as Kyle put it after a day of trying to extract an ODP that had somehow flipped and gotten wedged in the rocks!
Other instruments used by reef oceanographers are not described here because we don't have them on this expedition. Drifting buoys that follow water at 15 meters depth, measuring GPS position and water temperature over time, were not delivered to Honolulu in time for the expedition due to the hurricanes in Florida. Two other sensors will be installed on the Hi`ialakai later this year: an Acoustic Doppler Current Profiler that measures current velocity using the Doppler effect, and a sonar that measures biomass in the water column.
Putting It All Together into a Model of the NWHI
Visualize, if you will, a three dimensional model of the Northwestern Hawaiian Island chain. Imagine that we have represented this model in a computer such that we can attach the data gathered by the various devices just discussed to the corresponding location in the model. Now imagine that we can move a slider or use a play/fast forward/rewind control like on a video recorder to move this model through time, so we can store data taken at different times as well as different places. In other words, we have organized all the data collected in a four dimensional "space," where the first three dimensions are for the location of the various sensors discussed above (latitude, longitude, and depth) and the fourth dimension is for time.
In some places in this model, we will have detailed information such as temperature, salinity, chlorophyll and light levels, etc., measured continuously over a number of years. In other places we will have only temperature, and in some places we have measurements only once a year. Finally, in most places we have no measurements at all! But we have taken our measurements at enough locations that we can "interpolate" or predict mathematically the values the measures would be at the points in between those we actually took.
In some places and times we have different measures of the same thing. For example, we have the actual chlorophyll content of water and the estimate of that content taken by a radiometer or fluorometer; or we have the actual temperature and the estimated temperature taken by satellite. We can see how close these measurements are to each other, to better understand how we can use less expensive measures (such as a satellite) to estimate parameters that otherwise would require more expensive measures (sending people to the actual locations).
All of this data organized in space and time provides a physical model of the ocean environment of reef ecosystems. Marine biologists can use this model to understand what is affecting the prevalence and health of the various organisms of the reef. We will see how marine biologists find out what organisms are present in another article.
[1] Garrison (2002)