A Predator Dominated Ecosystem: Comparing the Fish of the Northwestern and Main Hawaiian Islands
Written By Dan Suthers
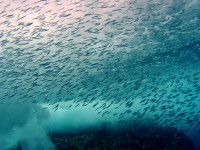
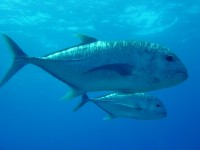
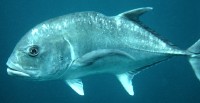 You may have noticed that many of the daily journals of this expedition refer to divers being escorted by ulua such as the Giant Trevally (Caranx ignobilis) shown here, a fish that is almost never seen in the Main Hawaiian Islands (MHI). We also see more predators of other species as well up here in the Northwestern Hawaiian Islands (NWHI), "more" being in terms of both numbers and size of individuals. In scientists' terms, the "predator biomass" being supported by the NWHI ecosystem is much larger than in the MHI, and there are differences in "fish assemblages." This article will explore these concepts, answering questions such as "Are there more fish in the NWHI than in the MHI?" "Why are there more and larger predators?" "What are the implications for the reef ecosystems?"
The year 2000 NWHI scientific expedition undertook the first systematic survey using rapid ecological assessment methods. Based on that data, Friedlander & DeMartini [2] published a paper summarizing the differences in fish populations between the MHI and NWHI. This article is based on their data.
Are there more fish in the NWHI than in the MHI?
Fish biologists find fish biomass to be a more useful measure of reef fish populations than numbers of fish. You can think of biomass as the combined weight of fish in a region. This is a better measure of the productivity of a reef (amount of fish life it supports) than numbers, because if you only count numbers of fish you can't tell the difference between 100 fish that are a few inches long and 100 fish that are nearly as big as you are. Clearly more food energy is needed to support 100 full grown ulua than 100 spotted tobies!
It would also be meaningless to compare the biomass of fish around a small island to that around a large atoll. This is where the concept of density comes in: biomass density is the biomass of fish per unit volume. In the Friedlander & DeMartini article [2], biomass is expressed in terms of metric tons per hectare [1]. So, in this discussion think in terms of the sheer weight of fish in a sample slice of the water column.
Now that we understand the units, let's answer a revised version of the question:
How do the fish biomass densities compare between the NWHI and the MHI?
Overall mean (average) biomass density in the NWHI is 2.44 tons/hectare, while the mean across the MHI it is 0.68 tons/hectare. That's over 3.5 times or 350% more fish by weight in a given amount of reef area in the NWHI!
| MHI: 0.68 |
******* |
| NWHI: 2.44 |
************************ |
This difference is quite striking, especially when you consider the fact that the MHI are much larger islands that provide the reefs with nutrients through runoff from vegetated watersheds. The extra nutrients should lead to a more productive ecosystem in the MHI reefs than the NWHI reefs, which are accompanied by very small islands or no islands at all.
If we look at individual islands and atolls rather than these two large regions, Pearl and Hermes Atoll is the most productive area in terms of fish biomass, with 4.64 tons/hectare; while Kauai is the least productive, with 0.41 tons/hectare. Why is the "garden isle" relatively sparse on fish, even falling behind O`ahu, where over 70% of the human population resides?
Why is there such a difference in biomass?
It is not difficult to identify the cause of these differences: the data speaks for itself.
Let's look at O`ahu. Hanauma Bay is the first "no-take" (no fishing allowed) marine protected area established in Hawai`i. If Hanauma Bay data is excluded from the O`ahu data, the biomass for the remainder (where fishing is generally allowed) drops to 0.24 tons/hectare: the lowest among all locations studied.
Now consider Kahoolawe, which is uninhabited and administered under rules that strictly limit reef fishing. Although terrestrial life on Kahoolawe is sparse, it has the richest fish ecosystem in the MHI as measured in terms of fish biomass: 1.28 tons/hectare, a figure similar to that of Kure Atoll.
We can learn more by comparing the types of fishes found at the locations studied.
How do the types of fish differ between the MHI and NWHI?
Scientists use the phrase "fish assemblage" to refer to the collection of species and their relative abundance in a given location. It's a convenient phrase, so we'll use it here as well.
Friedlander and DeMartini used multivariate statistics to place the islands on a statistical "map" based on their fish assemblages rather than on geographic location. Two islands are closer together on this map if they have similar fish assemblages, and further apart if the fish are different. Looking along the horizontal direction of their statistical map, the MHI are clustered together and clearly separated from the NWHI. That is, the fish species found around the NWHI are similar to each other but different from the NWHI. Looking along the vertical dimension of the map, basalt islands such as Gardner, Necker and Nihoa (around which the water drops off quickly into deep reefs exposed to ocean weather) are near each other and separated from the atolls and reefs (which have much more protected shallow water). This tells us that the type of fish differ according to their environments.
 Another useful term is "consumer guild": species belong to a consumer guild if they consume similar kinds of food. Friedlander and DeMartini compared three major consumer guilds: herbivores (which eat algae), lower level carnivores (small-bodied fish that eat fish and other animals), and apex predators such as the ulua and sharks that motivated this article. Apex predators are large fish that eat fish and other animals and are at the "top" of the food chain: they generally are not hunted by any larger species except for ourselves.
Comparing consumer guild biomass between the MHI and the NWHI, the differences are stunning.
In the MHI, 3% of the fish biomass consists of apex predators. Most of the fish are herbivores, followed by small carnivores (see table below). Before I researched this article, I would have thought that this figure makes sense: I thought of the food chain as a pyramid, with lots of little animals being eaten by progressively fewer numbers of bigger animals, and a small number of the real big predators eating everybody else. After all, one would think that it takes a lot of small animals to support a large animal. I was wrong.
Fish Biomass by Consumer Guilds
| |
Herbivores |
Small Carnivores |
Apex Predators |
| MHI |
55% |
42% |
3% |
| NWHI |
28% |
18% |
54% |
In the NWHI, a healthy undisturbed ecosystem that tells us what the distribution of fish biomass should be, more than 54% of the fish biomass are apex predators--that's 1800% greater density than in the MHI!!! Over half of the fish biomass are apex predators: my imaginary food chain "pyramid" is actually larger at the top! (More on this later.)
The difference in apex predators is most obvious when considering the ulua known as the giant trevally (Caranx ignobilis)--the fish that we have found to be abundant (and abundantly annoying!) as we conducted our work in the NWHI. Friedlander and DeMartini's team conducted 155 transects (see our article on REAs for an explanation) in the in the Main Hawaiian Islands--I estimate this to require over 30 hours in the water--but they only saw one ulua!
It should be no surprise that among the MHI, Kahoolawe had the highest and O`ahu the lowest proportion apex predators, respectively. The greatest proportion of apex predators acros the entire Hawaiian archipelago was found at Pearl and Hermes Atoll: 79% of the fish biomass!!!
This data helps us understand the differences in fish biomass and assemblages between the MHI and NWHI. Apex predators are among the most desired fish for fishermen (at least before we learned about toxins that concentrate in their flesh): if you catch a big fish, you've got a lot of fish for your efforts. They are also among the easiest to catch: if you bait your line with something that looks like a smaller fish, they will strike aggressively. Apex predators (as well as other species) have been overfished in the main Hawaiian Islands.
Overfishing can also reduce fish stocks in two other ways. First, as the larger fish of a given species are "fished out," progressively smaller fish of the same species are taken, reducing the number of fish old enough to reproduce. The species does not have an adequate opportunity to replenish itself, so declines. For example, over 32% of the endemic Hawaiian hogfish (Bodianus bilunulatus) seen in the NWHI were longer than 35cm, while only 4% of this species sought by fishermen reach that size in the MHI. Similarly, nearly 13% of the bullethead parrotfish (Chlorurus sordidus) in the NWHI are over 20cm in length, while less than 1% of this fishing target species in the MHI reach that size. Second, overfishing of the lower level carnivores and herbivores reduces the food available to the larger fish. Clearly, overfishing must be addressed if we want our children to have a viable fish population.
How can a reef support so many predators?
For me, this is the most fascinating question of this article. A superficial reading of an oceanography textbook suggests that the food chain is a pyramid. Giving an idealized example of the trophic pyramid (trophos means one who feeds), the textbook says that the production of 1 kilogram of tuna (an apex predator) requires that the tuna eat roughly 10 kilograms of midsize fish, which in turn must eat 100 kilograms of small fish, which themselves must eat 1000 kilograms of small herbivores (e.g., zooplankton), which eat 10,000 kilograms of primary producers (e.g., phytoplankton) [3]. This text also states that "each level is about one-tenth the mass of the level directly below" (p. 349).
But in the NWHI data, for every kilogram of apex predator there is less than 1 kilogram of all the other levels of fish combined! The food "pyramid" I expected turned out to be a top-heavy hourglass. How can we get more apex-predators than we have food to feed them?
From an energy budget standpoint, in order for 46% of the fish biomass (herbivores and small carnivores) to support 56% of the biomass (the apex predators), there must be a high replacement rate of the prey as they are grazed by the predator. In other words, although the stock available at any given time is not high, the productivity is very high. The aforementioned textbook gives figures implying that the productivity per unit of marine biomass is 357 times greater than that of terresterial biomass! The many tons of smaller fish needed to support a ton of apex predator biomass is produced over a period of time, and need not be present all at once. Clearly, the presence of large numbers of predators institutes a control on the populations of other fish. If they were removed, populations of smaller fish could get out of balance quickly. However, further study is needed, and the NWHI is the place to conduct this study.
What can we learn from the NWHI?
The authors of my source articles [2,5] state that the NWHI constitute the last large-scale coral reef wilderness remaining on the planet, and are among the few remaining large-scale intact predator dominated reef ecosystems. This is why those who know the area are so emphatic about the need for both conservation and study of the region. There is so much we can learn about predator-dominated ecosystems as they occurred in their natural state before we (Homo sapiens) replaced the other predators. Terrestrial ecology has long focused on the role of predation, but the role of predation has been overlooked in the study of coral reef communities, perhaps because much of coral reef research has been undertaken where the predators are long gone. The NWHI offers a rare opportunity to study a reef ecosystem when it is still in its predator-dominated form, and to rewrite our textbooks if necessary! We are fortunte that a region that by itself constitutes 69% of all the reefs in the jurisdiction of the United States (not including another 15% in the Main Hawaiian Islands) is still intact. If we impact this ecosystem as we have the main Hawaiian Islands, the opportunity to understand natural reef ecosystems will be gone forever.
[1] A metric ton is 1000 kilograms, which is similar to an English ton. A hectare is .01 square kilometers. If you read the original paper, you will need to know that scientists abbreviate metric tons per hectare as t ha-1.
[2] Friedlander and DeMartini (2002)
[3] Garrison (2002)
[4] Hoover (1993) - for fish names
[5] Maragos & Gulko (2002)
See also this related NOWRAMP 2002 feature story:
9/8/02 Counting Sharks - Mark Heckman