|
You
are here: /main/research
expeditions/June-July
2006/ Day 22
The Rosetta Stone of Mapping
Paulo Maurin, University of Hawaii and
Dena Deck, Bellflower Unified School District, California
In Collaboration with Joe Chojnacki, NOAA Coral Reef Conservation Program

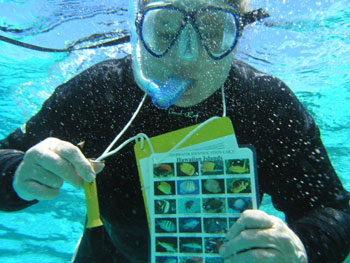
A diver armed with a camera is towed from a boat, obtaining many pictures that will be used to groundtruth mapping data. Credit: NOAA Fisheries Coral Reef Ecosystem Division.
When soldiers from Napoleons army found the Rosetta Stone, it was a breakthrough discovery. Carved in
ancient Egypt, it contained pieces of a message in known languages and also a language that had been
dead for centuries. Without any link to other known languages, historians had been unable to decipher
this language until the stone was found, which provided the necessary clues to translate it. Modern day
ocean mappers are looking for their own Rosetta Stone that will allow them to link backscatter data to
other ecological information.
Our ship, the NOAA ship Hi`ialakai, has a set of three sonars that, when used in conjunction, can provide
accurate data about the seafloor. When emitted by a sonar, a ping comes back bringing two pieces of
information with it: travel time and strength. The two-way travel time (the time it took from emission,
bouncing off the seafloor and return back to the ship), coupled with the measured velocity of sound in
the specific water location where the ship is traveling in, gives mappers a bathymetric view of the
seafloor, revealing the depth of each of its points. (See Painting
the Seafloor.)
A second piece of data obtained from each ping is the strength of the signal. When sound hits a surface,
above water or below, some of it is absorbed and the rest bounces back in what we experience as an echo.
The strength of this echo depends on the hardness of the material that the sound is bouncing from. This
is a very convenient fact of nature that is used when mapping to compliment the bathymetric map that
provides the depth. The acoustic hardness of a substrate, or ocean bottom, affects the strength of the
ping coming back to the sonar. In a real sense, the loudness of the echo changes if it is bouncing off
sand or rock. Sand, being soft and full of small holes in between grains, will absorb quite a bit of sound. A more solid surface like a rock will provide a bigger echo for each ping that hits it.
This strength of the signal coming back is called backscatter and provides mappers with a second view of
the seafloor. While bathymetry is a measure of the depth, backscatter gives us a clue about the nature of
the seafloor being mapped. Since coral reefs, with their calcium carbonate, provide a much harder surface
than a sandy sea bottom, the two will appear differently in the backscatter map. Values of intensity range
from low intensity, showing up as white and representing soft, sandy bottom, to high intensity, represented
as dark areas for harder substrate in the backscatter gray scale map.

A backscatter map, indicating substrate characteristics. Dark areas represent a harder seafloor, while lighter areas are indicative of a soft, sandy bottom.
Credit: NOAA Fisheries Coral Reef Ecosystem Division.

A map integrating backscatter map with bathymetry, showing the seafloor in rich detail. Credit: NOAA Fisheries Coral Reef Ecosystem Division.
When the backscatter map shows up binary data white and black it is easy to infer on the type of substrate
being mapped. The challenge is presented with all of the gray areas in the map. Does light gray represent
coarse sand? Is dark gray indicative of sand over rocks, or thousands of coral polyps? Or maybe just rock
covered by sand? Every shade of gray has a value that can indicate a type of substrate.
Backscatter alone cannot give you these answers. With so many variables present in the mapping process,
data needs to go through a ground-truthing process, or compared to visual observations of the sites. To
do this, researchers collect video, photographs and perform actual dive observations of many of the sites
that are mapped. These video and images need to be analyzed by a person. Its a tedious process that
cannot be automated - it requires having a person able to classify types of substrate from watching hour
after hour of video data or many photographs. And all of these data needs to be geo-rectified, or
coupled with GIS information to know exactly where each video segment and photograph was taken.
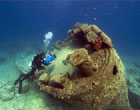
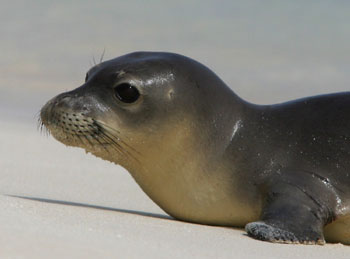
Sometimes the payoff for groundtruthing backscatter is unexpected: wrecks or rich coral beds can
be discovered.

Image
from a previous expedition used to ground-truth backscatter map, showing
a hard-substrate of coral cover, appearing as a darkened area in the
map.
Credit: NOAA Fisheries Coral Reef Ecosystem Division.
We do not have yet a backscatter signature for each type of substrate, or sea bottom, yet. This would be
the Rosetta Stone of mapping, a development which will allow mappers to correctly identify some of the
ecological characteristics of each area mapped. For instance, mappers are working towards refining their
backscatter analysis to allow them to tell apart live coral from bleached ones.

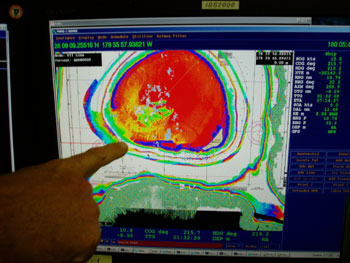
Backscatter showing on top, each of the blue dots shown across represent points were image data was taken to ground-truth the backscatter map. Red dots have the image showing below it, and the topography profile at the bottom. Note how images show first a mix of hard and soft substrate, a sandy bottom, and a hard substrate, each shown on backscatter as gray, light, and dark areas, respectively.
Credit: NOAA Fisheries Coral Reef Ecosystem Division.
The NOAA Coral Reef Conservation Program has built a pilot data set from the French Frigate Shoals,
consisting of large amounts of video footage, observations, and other data. They are in the process of
compiling all of this information with their backscatter maps they have for the area, and study how they
relate, trying to find meaning to each gray area in these maps.
When mapping, additional and unexpected discoveries can take place. Sometimes what we think of as
featureless terrains are revealed to have rich topographies. In 2004, an ocean area off the island of
Oahu in Hawai`i, thought to be featureless and plain, was discovered to have sand dunes and ridges,
providing important habitat to the marine fauna. Interpretation of backscatter data has improved in
quality over the years, and when combined with videos and photographs, remote characterization of sea
floor habitats becomes possible.
|